Version 1.1.0 "Parsley" Update
Posted on 3 Mar 2020 by Hyesu Jang
Description
We are pleased to announce the release of our first “Parsley” update. Version 1.1.0 “Parsley” is a minor release that includes some adjustments in force field: (1) Addition of three new bond and angle terms, a22a, b14a and b36a; (2) Modification of periodicity for N-N rotations; (3) Addition of missing improper torsions (i2a, i3a, i3b, i5a) with the associated torsions (t51a,t51b, t51c); and (4) Removal of redundant periodicity in t19.
Datasets for parameterization
- Roche set:: 686 1-D torsion profiles; 936 optimized geometries; 669 vibrational frequencies
- Coverage set:: 412 1-D torsion profiles; 842 optimized geometries; 265 vibrational frequencies
- Additional 19 1-D torsion profiles
Re-fitting Result
Details of the re-fitting result can be found in v1.1.0 release note.
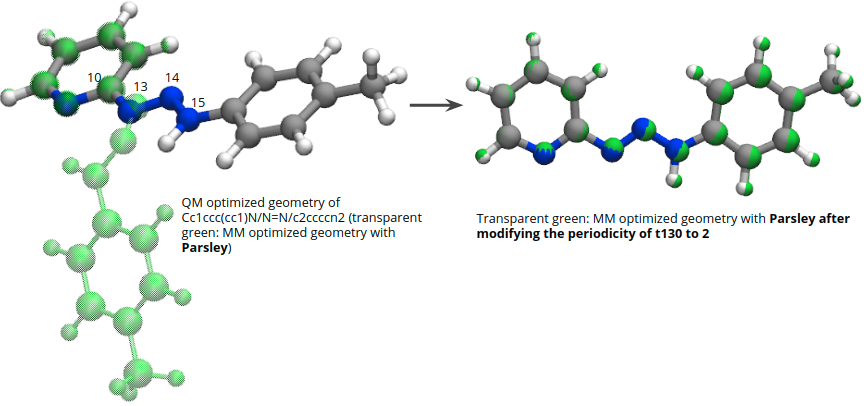
- Modification of periodicity for N-N rotation introduces significant improvement in reproducing QM optimized geoemetries of molecules having conjugated N-N bonds.

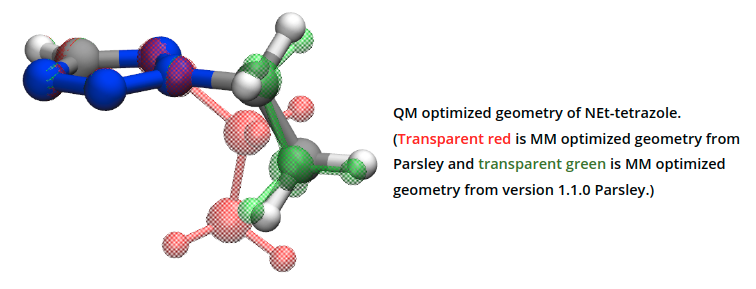
- Addition of missing improper torsions and their associated torsions fixes the problem with reproducing QM optimized geometry of tetrazole.

Benchmark Results
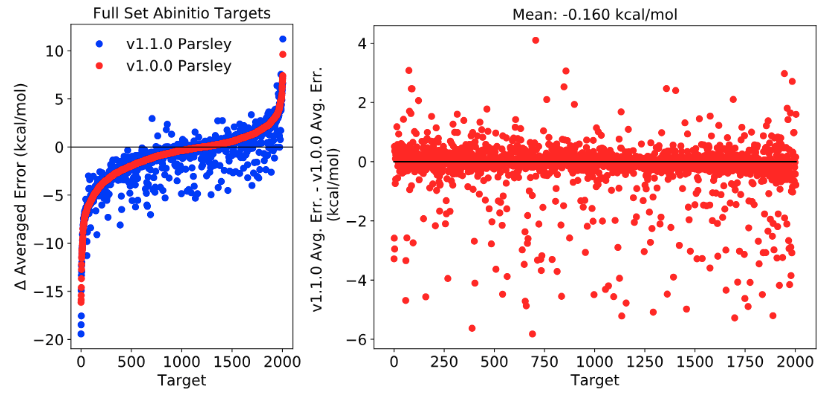
Benchmark results show that there is a slight improvement on reproducing QM optimized geometries and reproducing relative energies between conformers. Details of the benchmark results can be found in v1.1.0 release note.
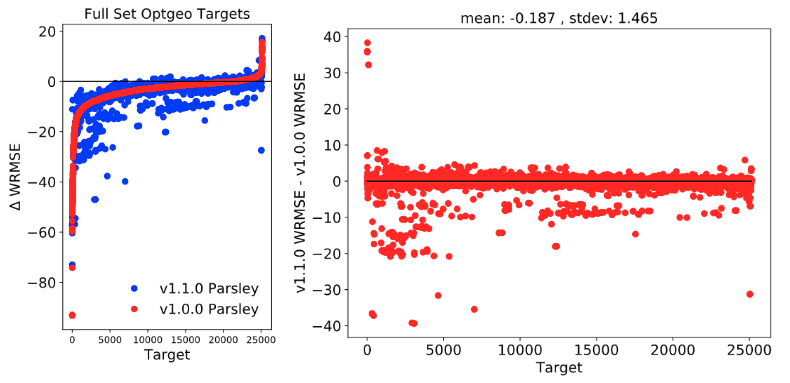
The weighted root-mean-square error (WRMSE) of each molecule, which is weighted root-mean-square deviation between internal coordinates of MM optimized geometry and QM optimized geometry was calculated for each parameter set then comparison of the WRMSE values was carried out.

Figure 1. Weighted root-mean-square deviation (WRMSE) between internal coordinates of MM optimized geometry and QM optimized geometry. The values on y-axis in the left plots (Δ WRMSE) are the changes in the WRMSE from initial force field to optimized force field – negative y values indicate better reproduction in the optimized force field compared to initial force field.

Figure 2. Absolute QM vs MM relative energy differences averaged over conformers were calculated for each parameter set. The values on y-axis in the left plots (Δ Averaged Error) are the changes in averaged error of from initial force field to optimized force field – negative y values indicate better reproduction in the optimized force field compared to initial force field.
